Data Visualization
Find on this page our latest public visualizations, based on business metrics for Latin America and France.
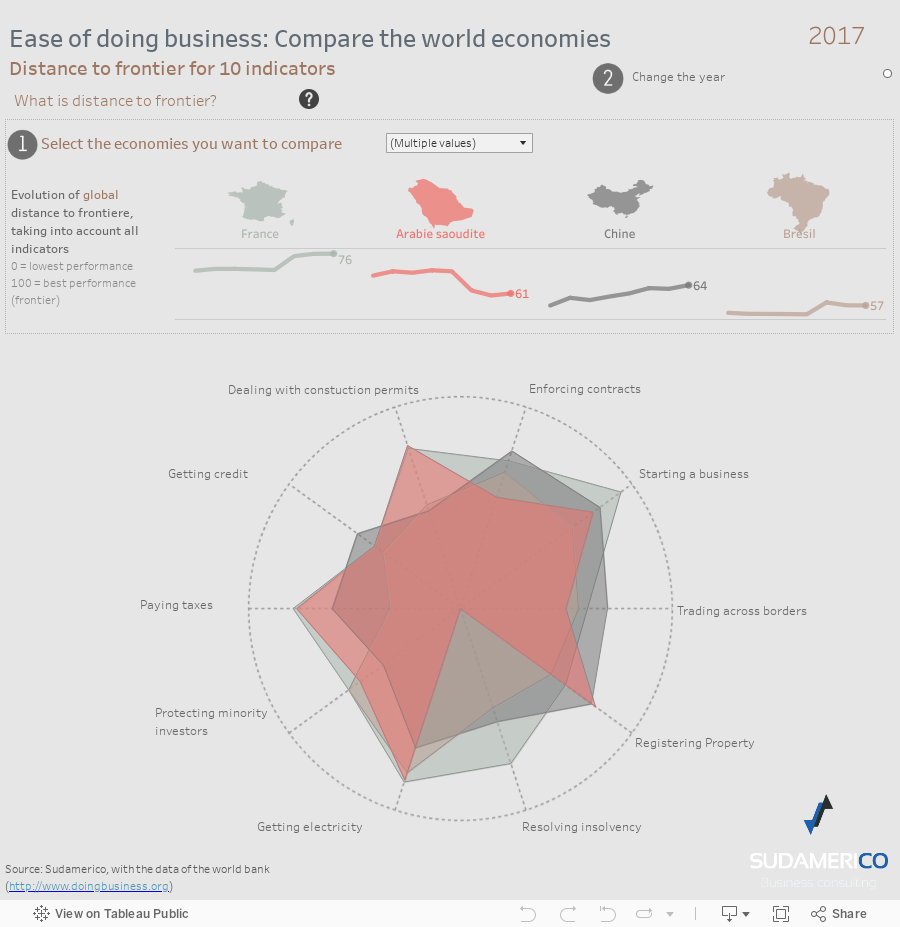
Ease of doing business: Distance to frontier
The World Bank ranks world economies on their ease of doing business, from 1–190. A high ease of doing business ranking means the regulatory environment is more conducive to the starting and operation of a local firm. The rankings are determined by sorting the aggregate distance to frontier scores on 10 topics, each consisting of several indicators, giving equal weight to each topic. The rankings for all economies are benchmarked to June 2017. Read the methodology, explaining how the ease of doing business rankings and the distance to frontier measure are calculated
This visualization focus on the distance to frontier score for the 10 topics that matters. Select up to 5 countries to compare their distance to frontier, and the evolution of the global distance to frontier over time. Is it easiest to open a busines in South Africa or in Chile? What is the best country for registering a property between New Zealand and United States? Between Senegal and Uruguay? What about dealing with construction permits? This visualization will give all these answers!
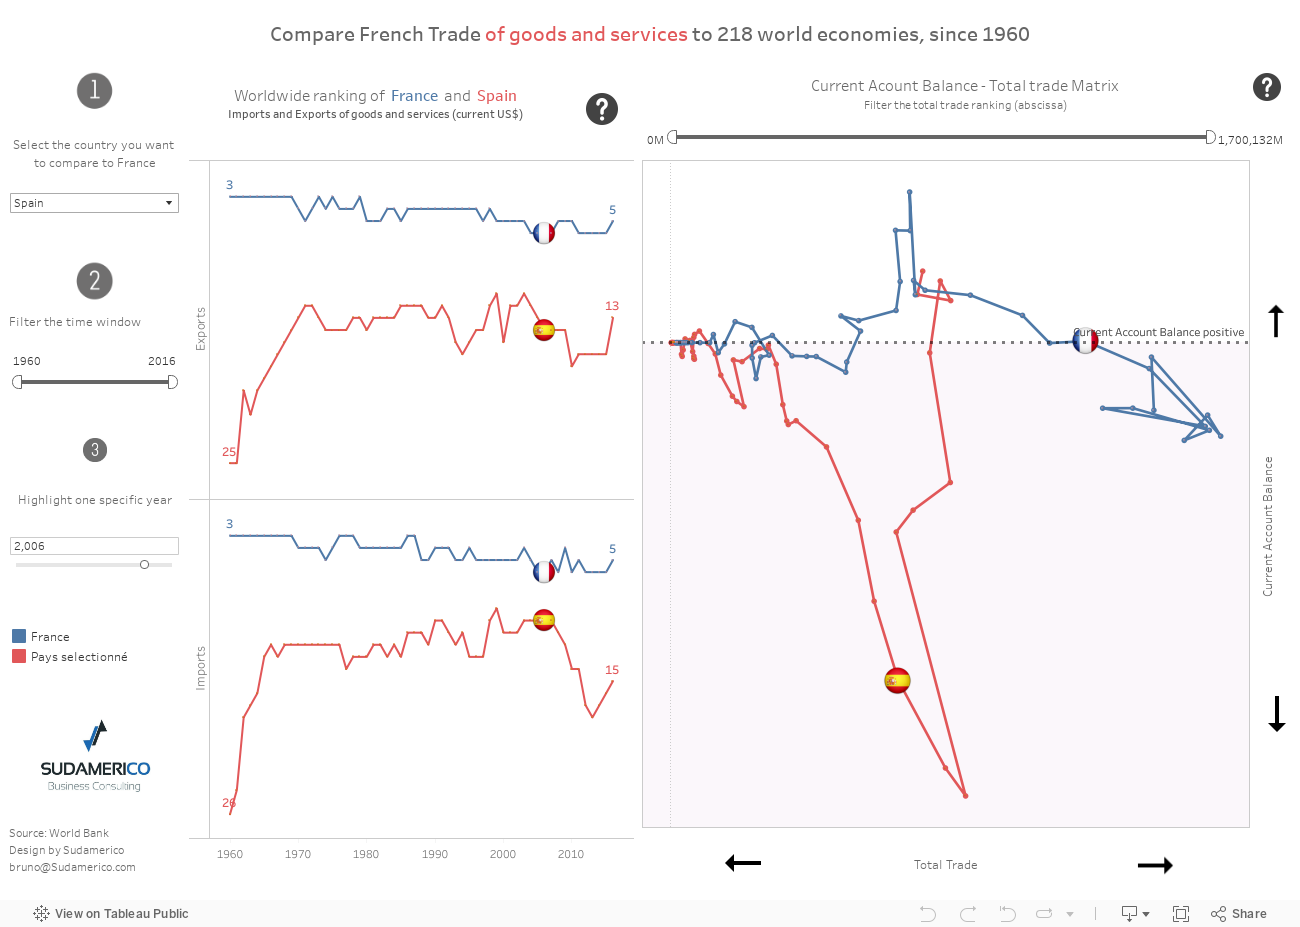
Compare French trade with world economies since… 1960!
This visualization focuses on three metrics: Exports, Imports and Current account balance (Current account balance is the sum of net exports of goods and services, net primary income, and net secondary income).
Compare the ranking of France and the country of your choice for the exports and imports of good and services since 1960. The matrix on the right is a very powerful tool to compare economies among time: you will be able to see that based on these two metrics (Volume traded and current account balance), France is struggling since 2007 at a level that United States overtaked in 1991.
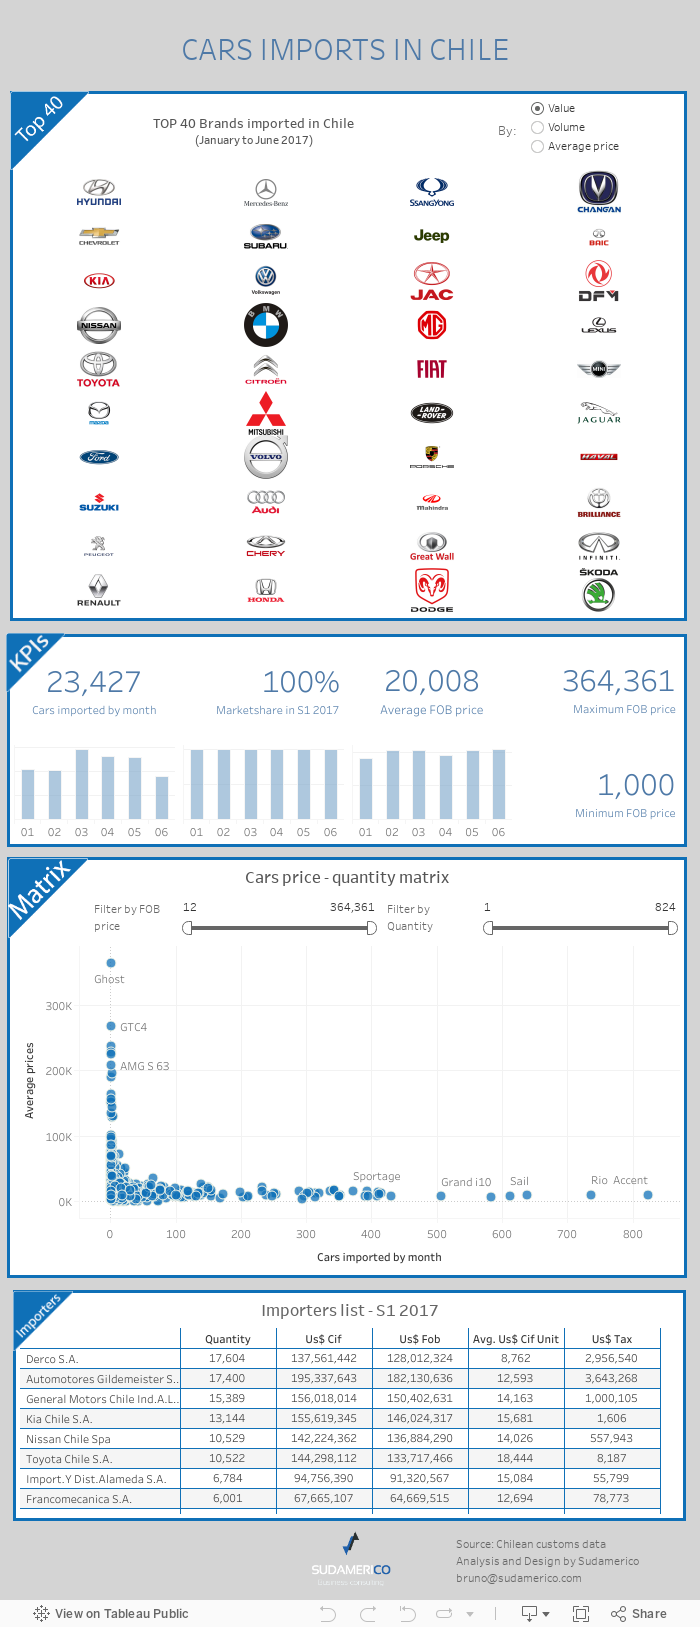
Car imports in Chile – S1 2017
Sudamerico has access to the best imports & exports data in Latin America. We also know how to extract the right information from these raw data. This visualization is an example focused on the imports of cars in Chile during the first semester of 2017.
Discover what were the top 40 brands imported in Value (total FOB amount imported), Volume (numbers of cars imported) or average FOB price (average price declared at Chilean customs). You will also be able to access for each of these brands the details of the cars imported! Did you know that the Volskwagen exports approximately 780 cars per month to Chile, and that the most expensive car model is the Touareg (5 models sold at an average price of USD 50 905 ) ?
And we also give access to the exhaustive list of the importers! Contact us if you want to access to full analysis.
Exports of Fruits from Costa Rica
Another example of the imports data transformed into a dashboard: 37 fruits categories, 399 exporters and the 1849 foreign buyers.
Analyse the trends of exports by fruit categories and regions and companies. Discover who are the main importers of Costa Rican fruits, the average price per fruit and market, etc. Contact us for the full analysis.

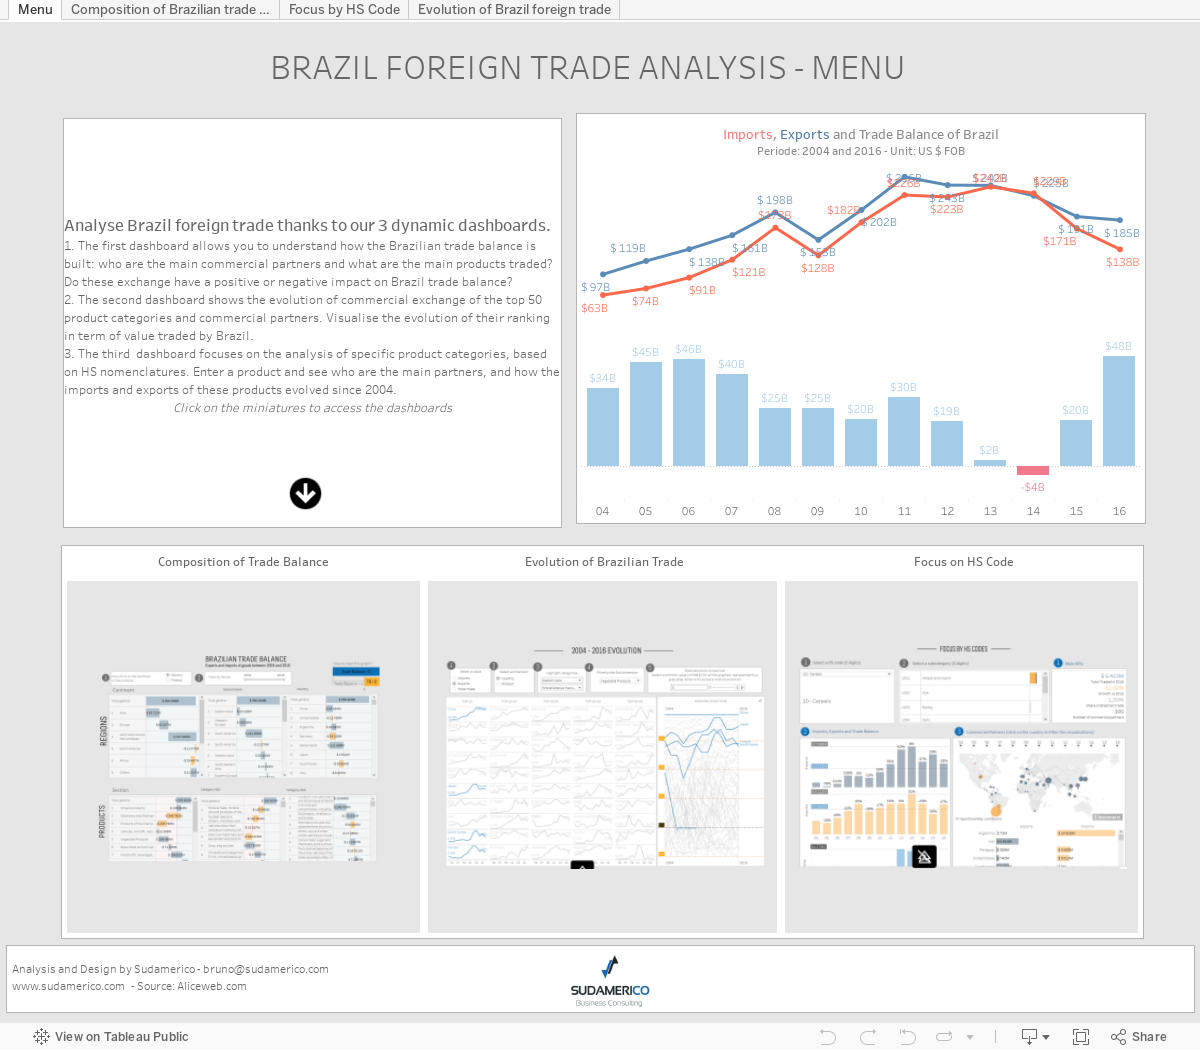
An analysis of Brazilian foreign trade
This analysis, based on 3 dashboards, will allow you to analysis in detail the foreign trade of goods: Dissect the trade balance by trade partners, analyse the evolution of trade since 2004 by products and partners, and analyse the brazilian trade by HS code.
This visualization has been selected by Tableau Public as Viz of the day.
Analysis of French trade with Latin America
This visualization analyzes the foreign trade of France with Latin America and its three main trade bloc: The Mercosur, The Andean Community and the Bolivarian Alliance for the Peoples of Our America.
This visualization has been selected by Tableau Public as Viz of the day.

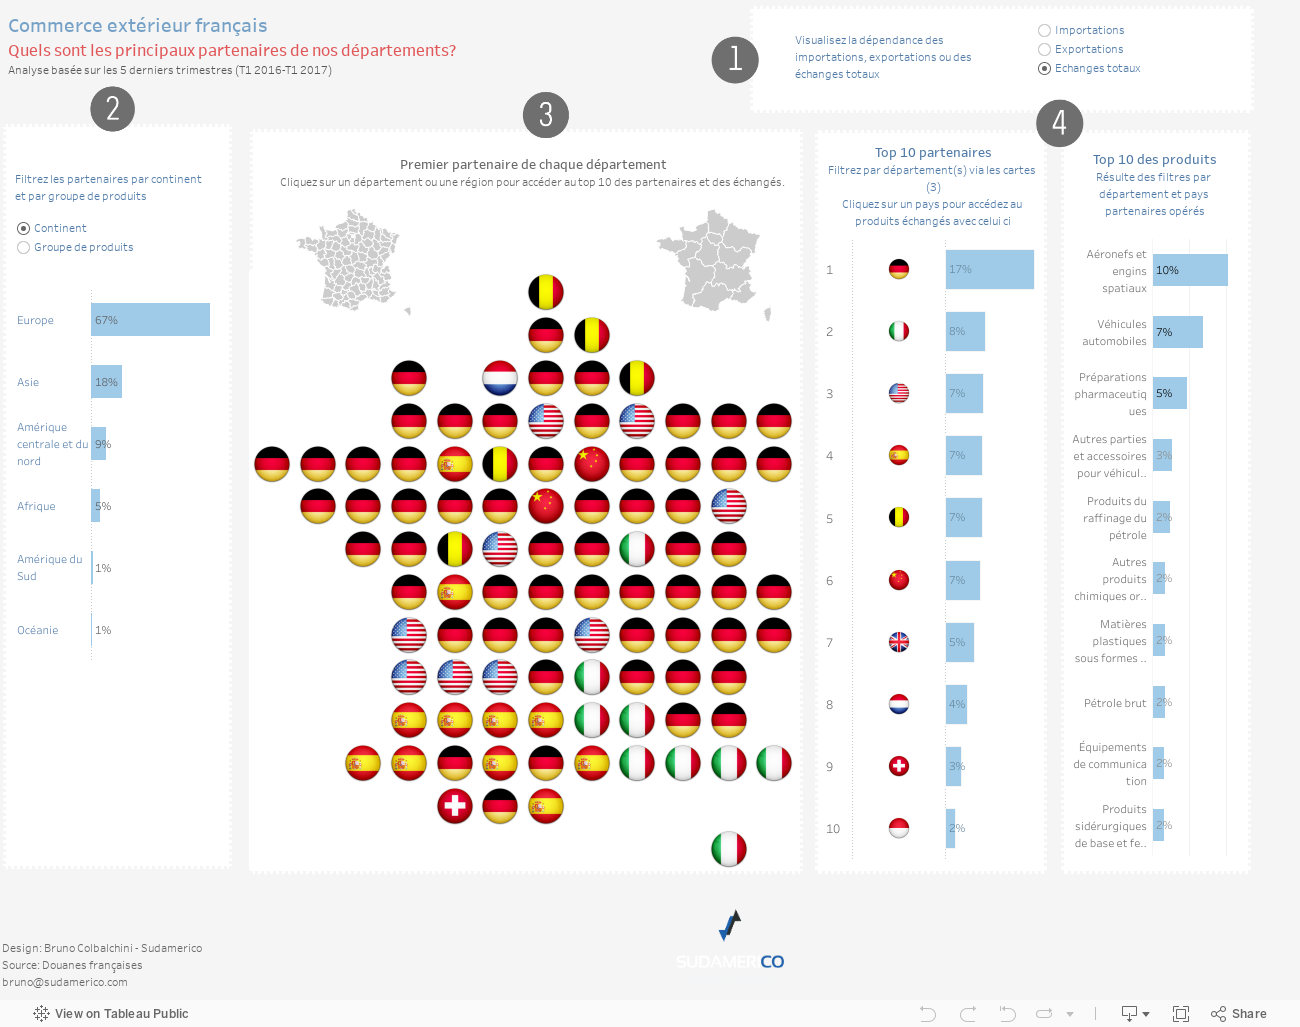
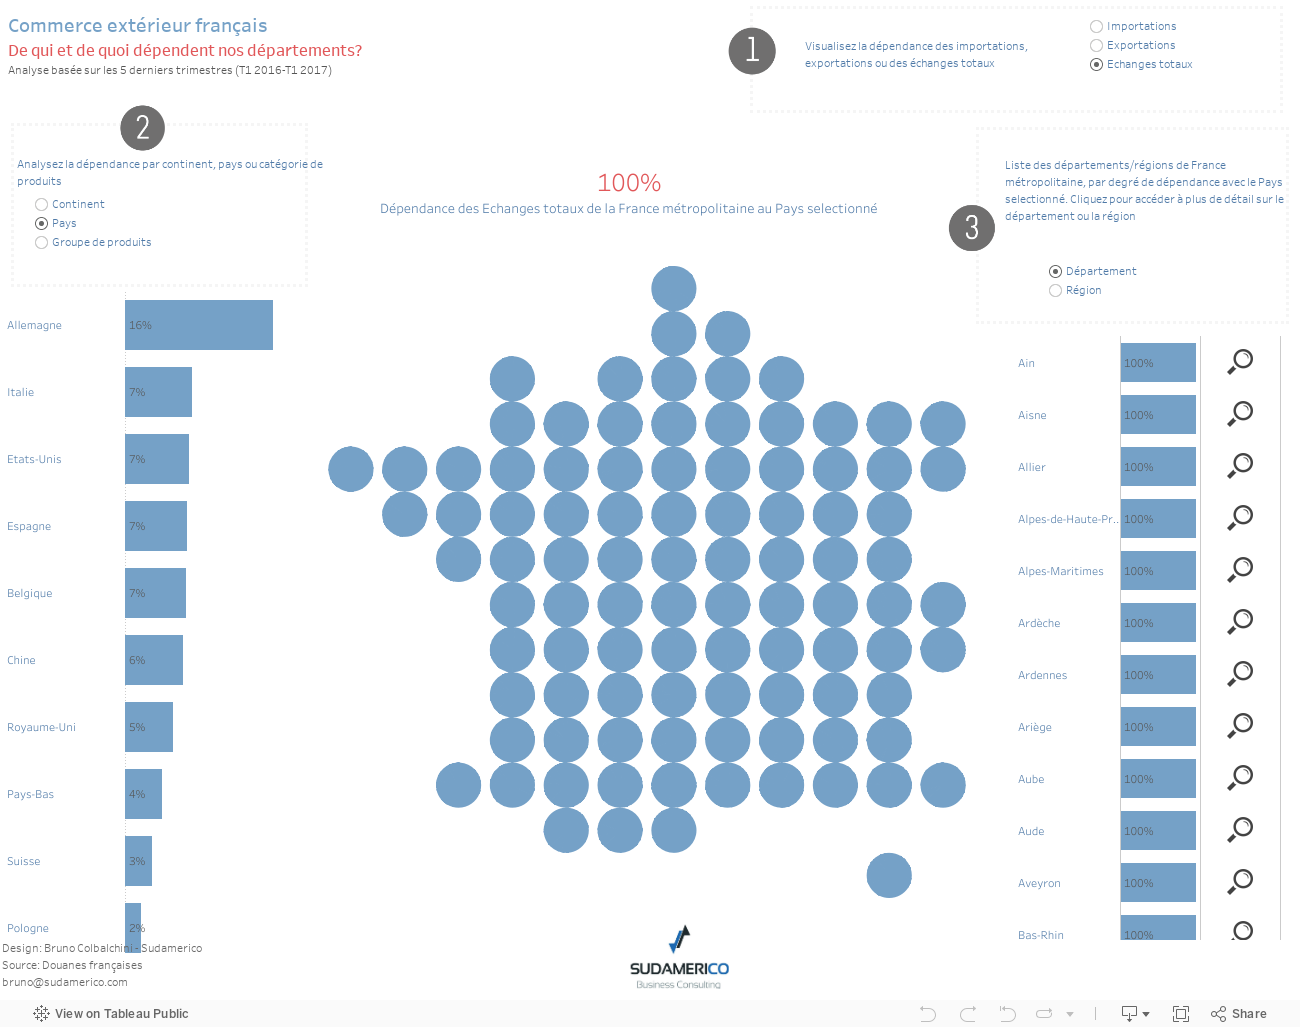
Focus on the trade of french departments
These two visualizations focuses on the trade of french departments.