
Our Services
1. Imports & Exports raw data
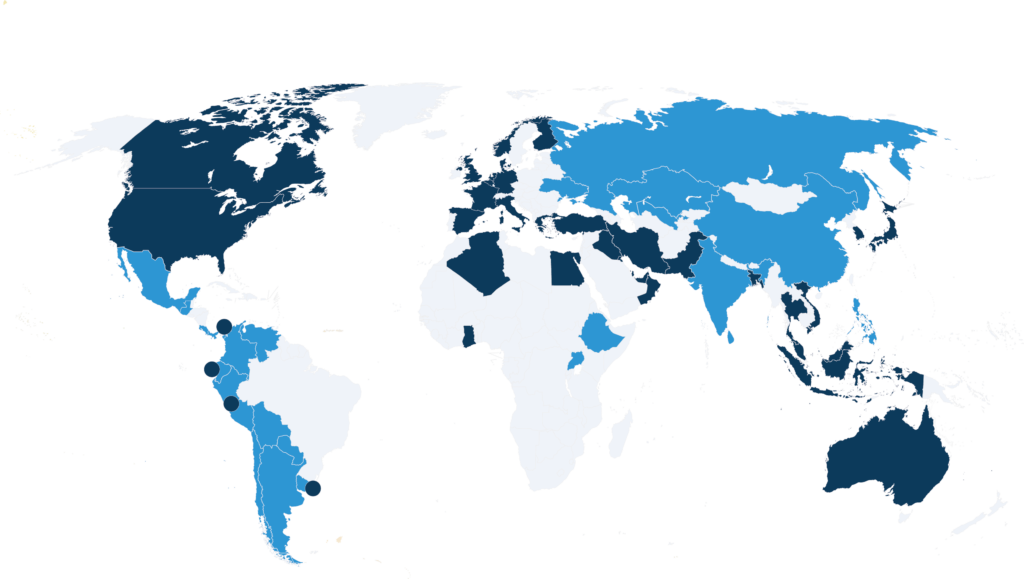
Sudamerico provides you with access to the Import & Export database covering more than 50 countries. You are just a few clicks away from accessing the details of every import or export to and from these countries: importers and exporters’ names and addresses, volume, value, price, freight forwarders, ports, incoterm, description of the products, brands, etc. Our monthly data is available from 2008 onwards.

« We Highly recommand Sudamerio data for any companies willing to do business in South America »
D. Sampaio, Director Eramet Latin AmericaWe can give you access to two types of data:
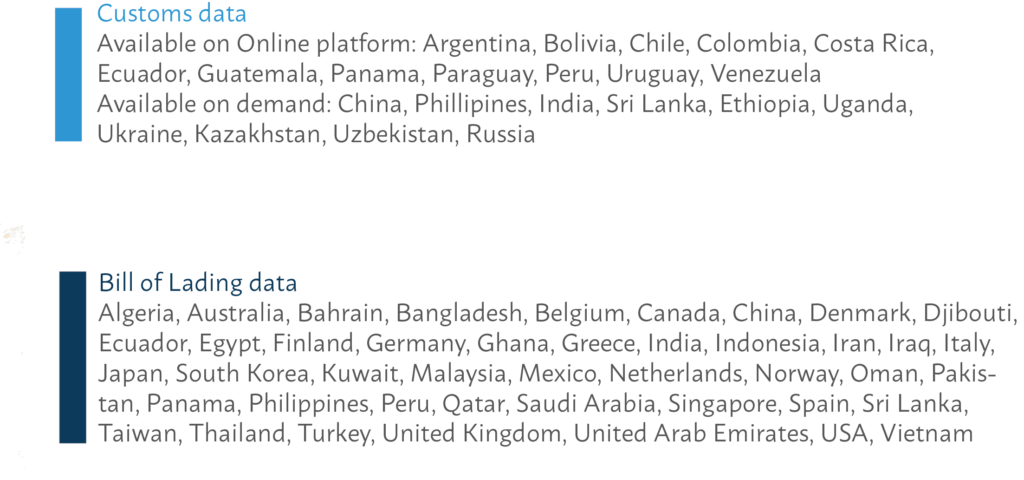
–Customs data: which covers 100% of a country foreign trade. This data comes directly from the customs authorities. Each transaction is detailed with the information of the importers or exporters, foreign buyer or suppliers, product details, etc.
–Bill of Lading data: which gives you access to all the logistic details of the transactions: consignee, shipper, ports, containers type, warehouse, freight forwarder, custom agent, etc.
Thanks to these data you will be able to
Identify Potential customers and partners
Track your competitors
Base your decisions on the best information
Optimize your logistic
Diversify your sales
Three ways to access the data
- Online platform: we can give you access to our platform, which will allow you to download all the data you want, for any HS code and country. This platform covers the following countries: Argentina, Bolivia, Chile, Colombia, Costa Rica, Ecuador, Guatemala, Panama, Paraguay, Peru, Uruguay and Venezuela
- Bulk data on demand: We can send you custom data adapted to your industry, by HS code, company, year, etc. We also provide our full dataset: 100% of the imports or exports data of one or several countries.
- Processed data: We can bring together the data of your interest, from various countries, and of varying file formats, and build one consistent dataset by cleaning and harmonizing the raw data.
Download some examples of Customs data


Download some examples of Bill of Lading Data


2. Data visualization
Data visualization is a new, common language with infinite applications for data exploration and communication. Moving away from traditional key performance indicators and static charts to more appropriate and interactive representations of data unlocks new ways of understanding the data faster and more efficiently.
We will transform raw import and export data into visually appealing, interactive visualization, allowing instantaneous insight. Our dashboards are updated automatically and available online, via a personal account created for you. They are the only way to take advantage of all the strategic information included in the millions of lines of import and export data we have access to.
You will be able to switch instantly from a macro view (size, trends of a market, etc.) to a micro view (exhaustive imports of a potential partner, prices of your competitors, etc.). Our dashboards are customized and adapted to your needs.

« Sudamerico provides a very quality and sharp service, in which you can analyze market size, volume potential, price references and estimated market share based on the data available. »
N. Zaugg - EVP Americas at MotulMarket Overview dashboard
These dashboards allow you to visualize and interact with international trade statistics: Country or Commodity Profile, National or Regional market overview, Market Segmentation, etc. We build a customized dashboard adapted to your needs, and update it on a monthly, quarterly or yearly basis.
Access to sample dashboards by clicking on the images below
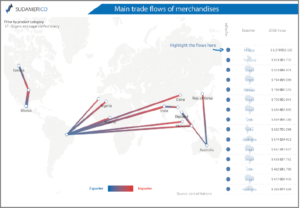
Main trade flow of merchandises
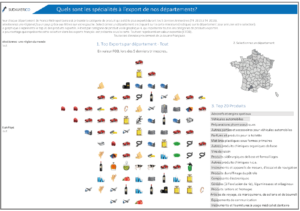
Exports of French departments
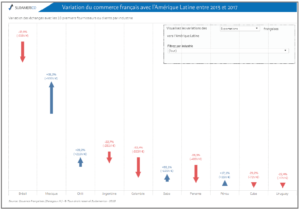
French trade variation with Latin America
Business Intelligence Dashboard
These dashboards are based on import and export data. We process millions of rows of information and transform it into customized dashboards adapted to your needs: Benchmarking, Prospecting or Monitoring.
You will be able to switch instantly from a macro view (size, trends of a market, etc.) to a micro view (exhaustive imports of a potential partner, prices of your competitors, etc.).

Colombia Foreign Trade example

Costa Rica fruits exports example

Activity of French companies in Colombia – Demonstration
3. Business Intelligence infographics
We build infographic fact sheets with all the information about the market or about the company of your choice. Our fact sheets are customized and designed to answer your main questions. Is there potential for my product in this specific market? Who are the main actors in this market? What is the activity of my competitor in this country? Is my price strategy adapted to this market?

« The results of the analysis have been impressive and allowed us to have a better vision of the targeted markets, even though we knew that our products were very specific. »
J. Trigneau, Commercial Director at BCF Life ScienceOur fact sheets have three levels:
-Macro: We focus on the trade flows between countries, market share, average price, market segmentation, growth rates, etc.
-Meso: We focus on the actors of a market: Who are the main importers, exporters, suppliers, foreign buyers? What are their market shares? Who are your competitors and your potential customers? What are your competitors’ prices?
-Micro: We focus on the activity of one or several companies. What are the products exported or imported? What is their price strategy by product? What are their customers or suppliers? What is their supply chain: ports, warehouses, freight forwarders?

Example of Macro fact sheet

Example of Meso Fact Sheet
4. French importers & exporters database
We have extracted from our data all the transactions involving French companies, which we have identified with specific algorithms. The result is a database of thousands of French importers and exporters, that you can explore and filter by several criteria: activity, localisation, turnover, number of employees, etc.
This database gives you access to the details of all the transactions made by these companies: products exported and imported, names of partners, price, logistic details, etc.

« Sudamerico allowed us to accurately identify the market of companies buying abroad and to better target the value that American Express can bring to its customers »
Charlotte De Bagneux – Senior Manager – Corporate Finance Solutions1. Define the local perimeter
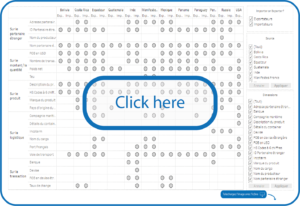
Use our interface to build your own database of French companies that meet your criteria: specific location, activity, country of activity, turnover, products exported, size, etc.
With the interface on the right, you can filter the data by the criteria of your choice and estimate the number of French companies that meet those criteria.
Tip: Use the interface to create your perimeter, print the picture of the dasboard and send it to us via the contact form!

2. Select the transaction details you want to have access to
What is the level of detail you need to build your commercial strategy? You can have access to all the details of every transaction made by these French companies since 2015: partner names, product and logistic details, volume, price, etc.
The unit price per company will vary according to the level of detail.
Access the interface on the right to visualize the information available for your perimeter.
Tip: Use the interface to select your dimensions, print the picture of the dasboard and send it to us via the contact form!
4 kind of databases are available. The price displayed below is the price per french company, for a mimimum perimeter of 500 french companies.
Basic€1-3
per french company- French Company Name and ID
- Partner country
- Yearly detail
- FOB Value / Weight / transactions
Premium€3-5
per french company- Details of BASIC Access
- French company full details
- HS Codes
- Monthly Details
Customized€2-20
per french company- Up to 10 fields
- Partners details
- Commercial details
- Logistic details