
Brazil International Trade Visualization – Q2 2016
Every quarter, we publish a visualization about Brazil International Trade
This week, we decided to update this quarterly dashboard with an innovative visualization. With only 4 graphes, you will be able to dissect Brazil foreign trade evolution with its 20 main partners.
Products have been classified in 1200 categories! You will therefore be able to visualize the main partners and the trends for the industry that matters for you.
Enjoy, and do not hesitate to give us your feedback!
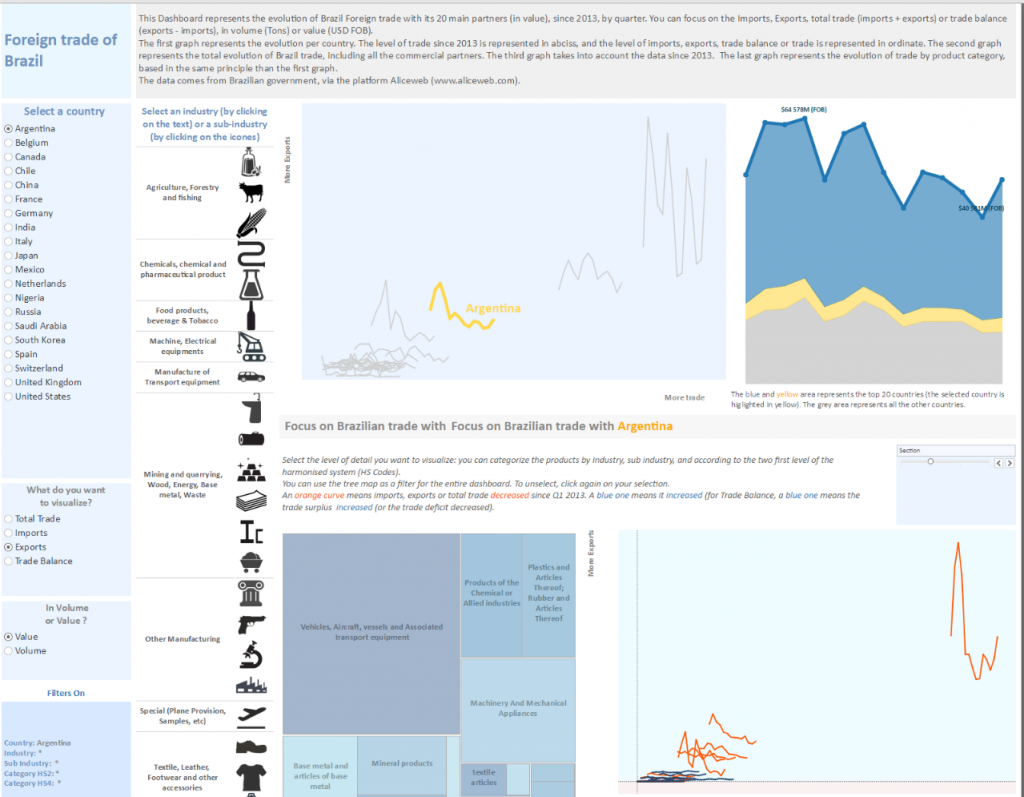
click on the image to access the visualization